

Analytics & Dashboard
Analytics & Dashboard
Section titled “Analytics & Dashboard”The Analytics dashboard gives you a complete picture of how your AI bot and support team are performing. Use it to measure effectiveness, identify knowledge gaps, and continuously improve your bot.
Dashboard Overview
Section titled “Dashboard Overview”The main dashboard shows high-level KPIs at a glance:
| KPI | Description |
|---|---|
| Total Conversations | Number of conversations started in the selected time period |
| AI Resolution Rate | Percentage of conversations resolved by the bot without human handoff |
| Avg. Response Time | Average time from user message to first bot or agent reply |
| Handoff Rate | Percentage of conversations escalated to a human agent |
| Active Users | Unique users who interacted with the bot in the period |
| Positive Feedback Rate | Percentage of thumbs-up reactions out of all feedback submitted |
Use the date range picker to filter all metrics by day, week, month, or a custom range.
RAG Analytics
Section titled “RAG Analytics”The RAG Analytics section shows how the retrieval pipeline is performing:
- Retrieval Success Rate — Percentage of queries where the system found relevant content in the knowledge base
- Top Retrieved Documents — Which documents are retrieved most often, indicating high-demand topics
- Avg. Relevance Score — Average confidence score from the re-ranker across all queries
- Query Volume by Hour — Message volume heat map to identify peak usage times
Use this data to identify documents that are rarely retrieved — they may need better titles, more keywords, or a content review.
Unanswered Analytics
Section titled “Unanswered Analytics”The Unanswered Analytics section surfaces questions the bot could not answer:
- Unanswered Questions List — A chronological list of questions that resulted in a low-confidence response or handoff
- Topic Clustering — Questions are automatically grouped by topic so you can spot patterns
- Topics Without Docs — Topics that appear frequently in unanswered questions but have no matching document in the knowledge base
Use the Export button to download the unanswered questions list as CSV for offline review or to share with subject matter experts.
Message Feedback
Section titled “Message Feedback”Users can rate bot responses directly in the chat widget:
- 👍 Thumbs Up — Response was helpful
- 👎 Thumbs Down — Response was not helpful
The Analytics dashboard aggregates this feedback and shows:
- Feedback volume over time
- Most downvoted responses — with the original question and bot answer, so you can investigate and improve
- Feedback trend — Whether satisfaction is improving or declining over time
Sentiment Analytics
Section titled “Sentiment Analytics”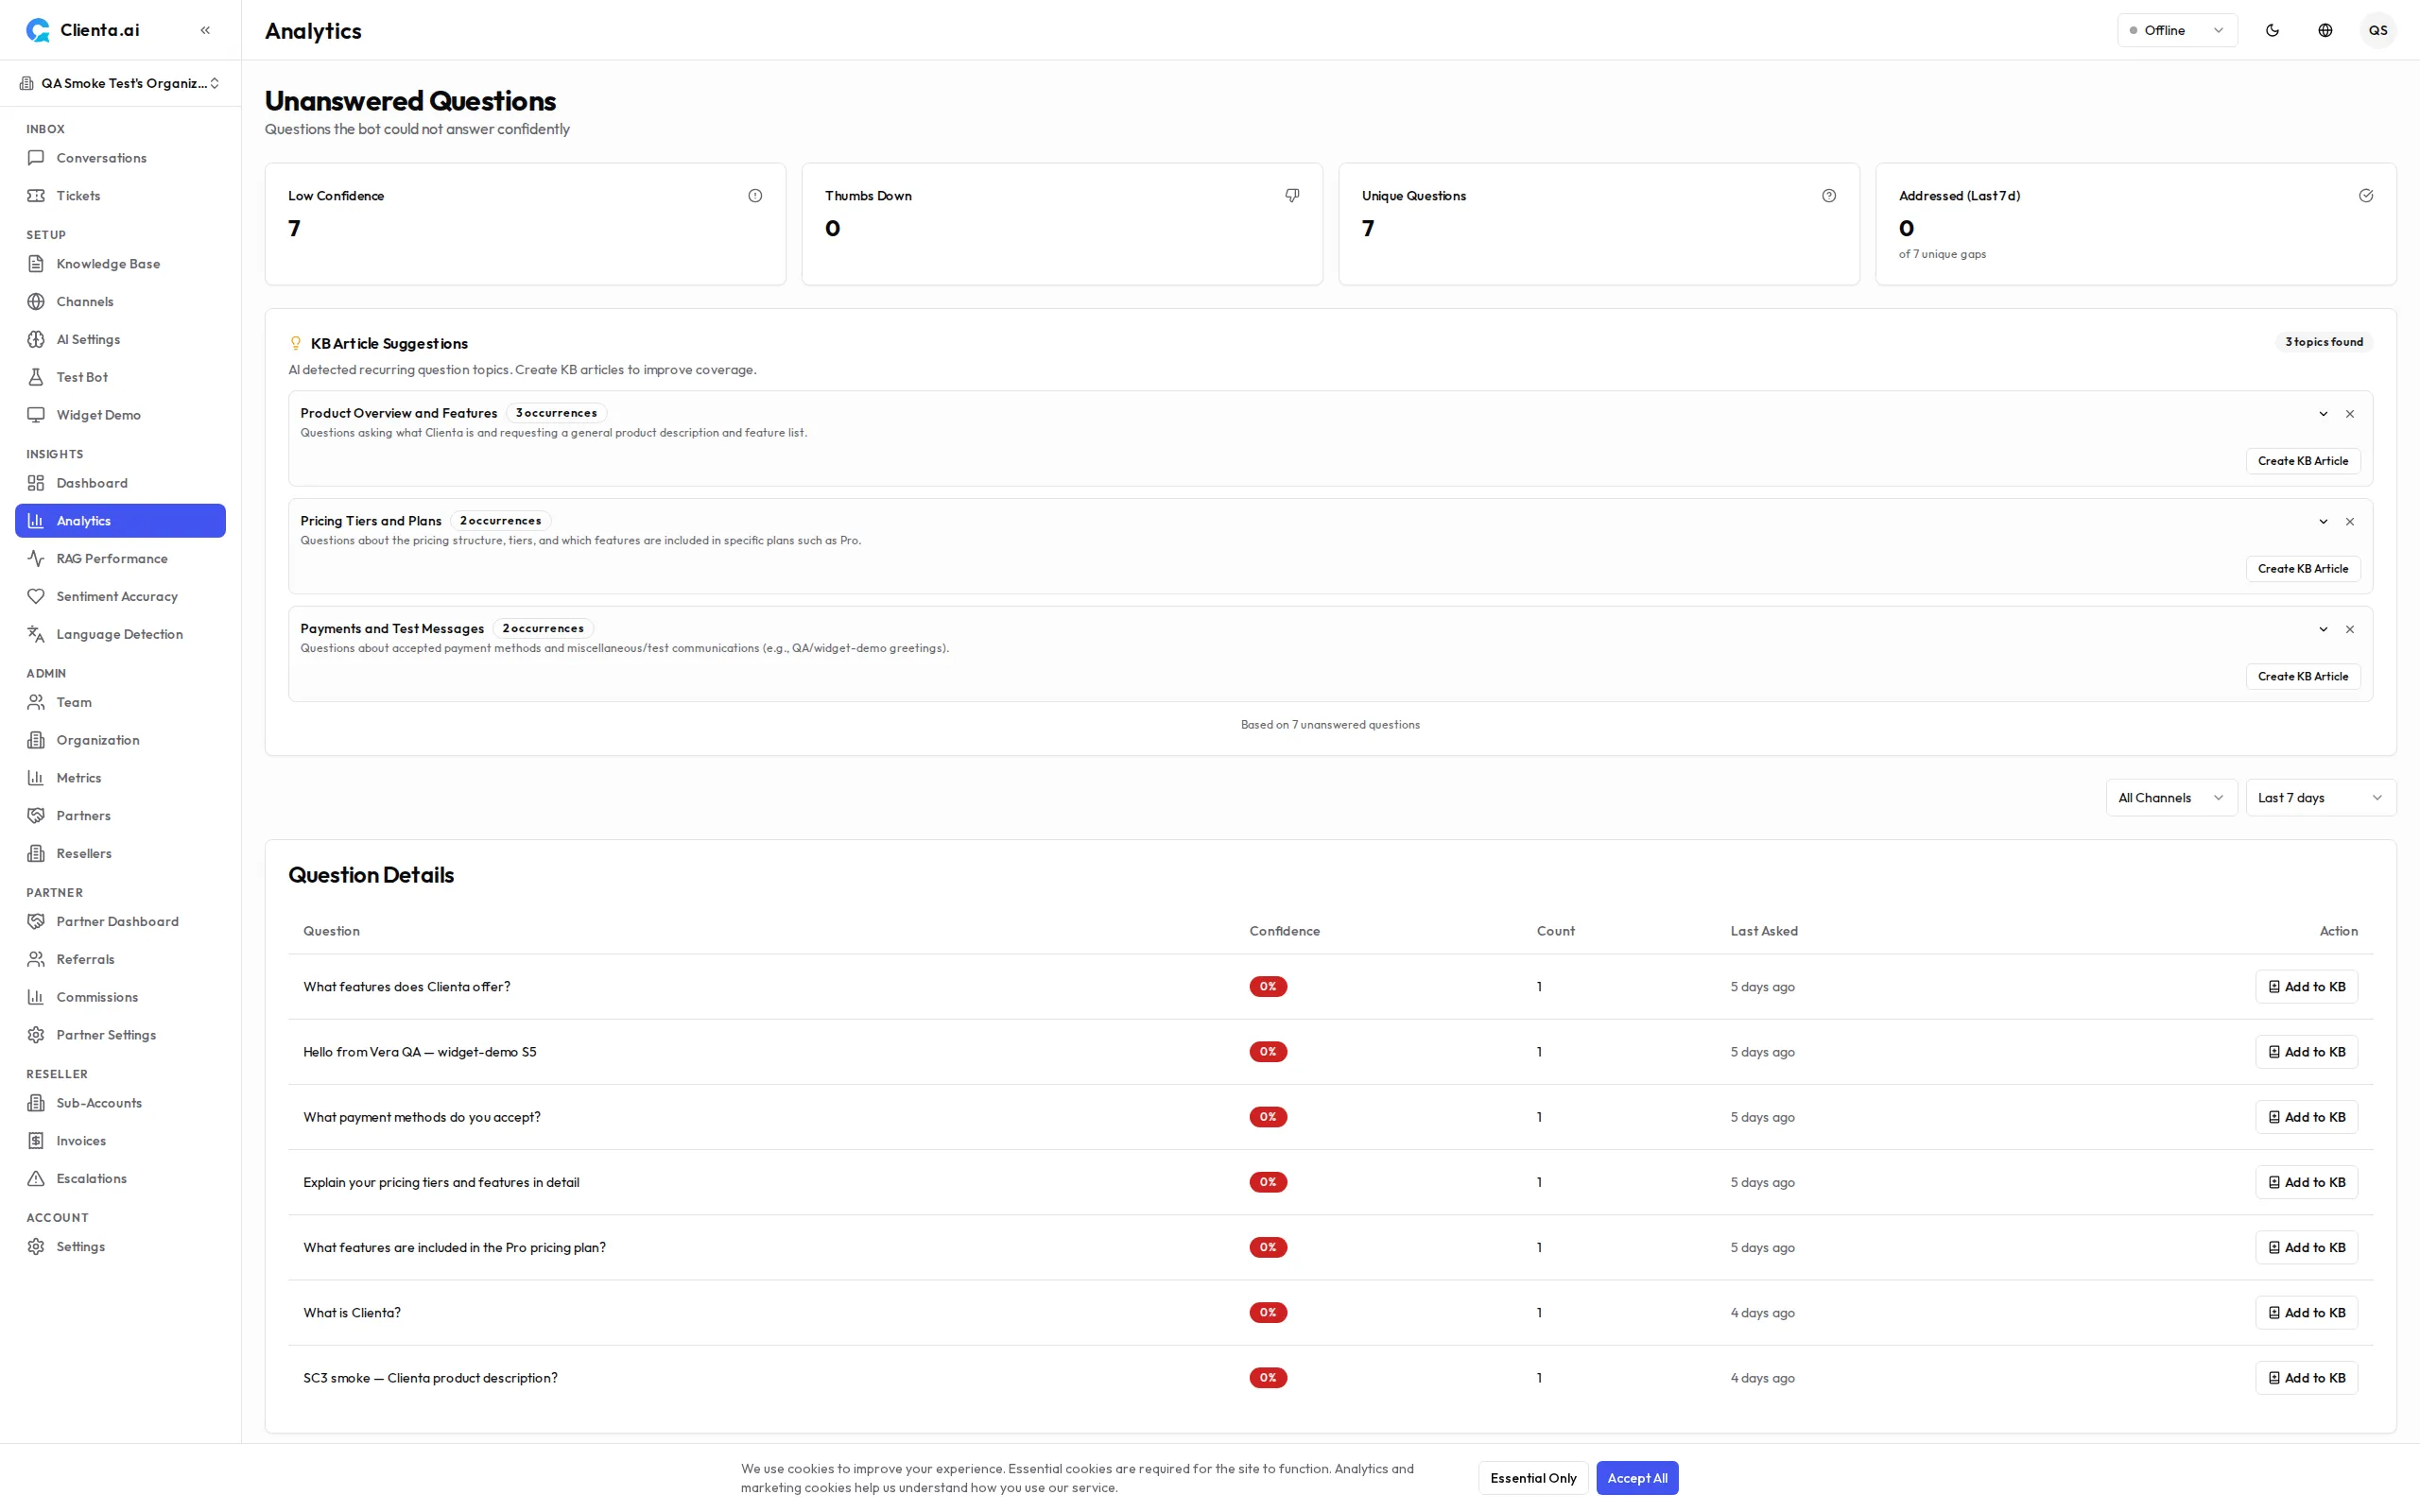
The Sentiment Analytics section provides ML-powered analysis of customer sentiment across conversations:
- Sentiment Distribution — Breakdown of conversations by detected sentiment (positive, neutral, negative)
- Sentiment Trend — How overall customer sentiment changes over time
- Negative Sentiment Alerts — Conversations flagged with negative sentiment are surfaced for priority review
- Sentiment by Topic — Which topics tend to generate negative sentiment, helping you identify problematic areas in your knowledge base
Sentiment data feeds into the sentiment-aware routing system (see Human Handoff) — conversations with detected negative sentiment can be automatically prioritized for faster human agent response.
Conversations Trend Chart
Section titled “Conversations Trend Chart”The dashboard includes an interactive Conversations Over Time area chart that visualizes daily conversation volume as a smooth gradient area graph. The chart uses your theme’s primary color and provides:
- Date axis — Shows dates along the horizontal axis
- Conversation count — Vertical axis displays the number of conversations per day
- Hover tooltip — Hover over any data point to see the exact date and conversation count
- Responsive layout — Automatically resizes to fit the dashboard width
Use this chart to identify trends in conversation volume, spot peak usage days, and correlate volume changes with events like product launches or marketing campaigns.
Admin Metrics
Section titled “Admin Metrics”Admins have access to additional operational metrics:
- Agent Response Time — How quickly human agents respond after taking over a conversation
- SLA Breach Rate — Percentage of handoff conversations that exceeded the SLA target (see Human Handoff)
- Conversation Volume by Channel — Breakdown of conversations by Web Widget, LINE OA, and other channels
- Knowledge Base Coverage — Document count, total chunks indexed, and last updated timestamps
- Cost per Conversation — Estimated AI inference cost per resolved conversation (Enterprise plan)
All admin metrics can be exported as CSV or viewed as charts in the dashboard.
Language Detection Analytics
Section titled “Language Detection Analytics”The Language Detection Analytics page (Analytics → Language Detection) gives admins visibility into how visitor languages are being detected across conversations.
Key metrics:
| Metric | Description |
|---|---|
| Top Languages | Distribution of detected languages across all conversations in the selected period |
| Detection Method Breakdown | How each language was identified — Unicode script analysis, browser language header, diacritics, or conversation continuity |
| Detection Rate | Percentage of conversations where language was successfully detected vs. defaulting to org language |
| Daily Language Trend | Volume of conversations per language over time |
Date range: Use the selector in the top right to filter by last 7, 14, 30, or 90 days.
Use this data to:
- Verify that the language detection is working correctly for your customer base
- Decide whether to enable the Widget Language Selector for specific locales
- Identify whether customers are using languages that are underrepresented in your knowledge base